As the tractors arrived in Brussels yesterday, it is important to keep a sense of perspective. European farm incomes broke a new record high in 2025 – also in real terms – although not all farmers participated in this. But amid all the doom and gloom spread about an industry on its knees (a narrative with an explicitly political objective), and despite the evident challenges, it is even more important to keep an eye on the underlying facts.
The record farm income is reported in Eurostat’s first estimate of the economic accounts for agriculture earlier this week. This gives a snapshot of the economic health of the agricultural sector, summarised in what Eurostat calls Indicator A.
Indicator A represents an index of the real factor income per annual work unit (AWU) in agriculture. It measures the remuneration of all factors of production (land, capital, labour) by the equivalent of each full-time worker in the agricultural industry, presented in real terms (adjusted for inflation) and expressed as an index. Eurostat refers to it as an index of agricultural labour productivity. This post explores what we can learn from this latest release.
2025 was a positive year for farm income on average
Sources: Eurostat domains aact_eaa05, aact_eaa06 and aact_ali02.
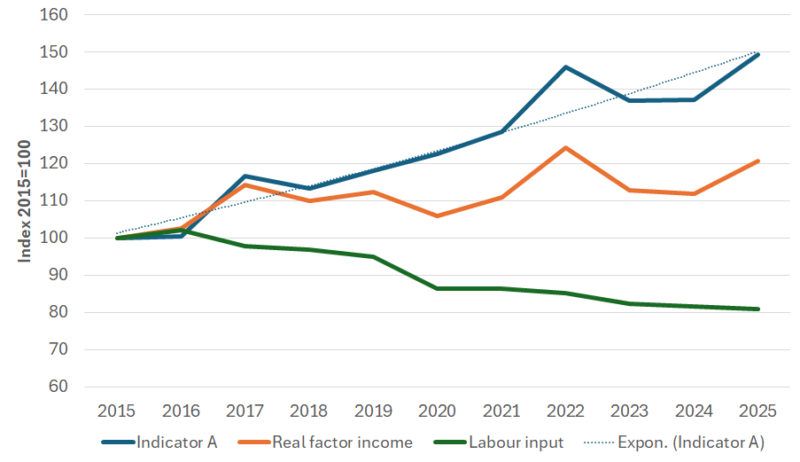
The trend in Indicator A for the EU27 between 2015 and 2025 is shown in Figure 1. This also shows the trends in its two components, real factor income and labour input.
- Real income per full-time labour unit working in agriculture (Indicator A) reached its highest level ever in 2025, slightly exceeding its previous record level in 2022. Eurostat estimates that there was, on average across the EU, an increase of 9.2% in real income per AWU in 2025 compared to 2024. Nonetheless, the 2025 figure is not untypical and lies exactly along the trend line over the period. Of course, this is an EU average, averaging across countries and enterprises which have had very different trajectories. Still, it is worth keeping this positive outcome in mind following a day when tractors converged on Brussels in another farmer protest.
- This improved agricultural income per head is due to both increases in the real value of factor income and reductions in the agricultural labour force in roughly equal measure. Real factor income in the sector peaked in 2022 and then fell back in 2023 and 2024, only to recover again in 2025 although still below the 2022 peak.
- There has been a steady fall in the number of full-time equivalent labour units (AWU) working in EU agriculture, with a particularly noticeable step-change between 2019 and 2020. This seems to be due mainly to changes in statistical methodology introduced with the 2020 Agricultural Census, possibly around the way part-time work on farms was enumerated and converted into full-time equivalents. The step change is largely due to enumeration changes in Romania (a 22% reduction in the enumerated agricultural labour force between 2019 and 2020) and Poland (a 15% reduction). An alternative explanation, that the reduction is due to Covid in 2020, is unlikely, both because the step change has not been reversed, but also because the expected effect of Covid would have been to increase the amount of part-time work on farms as family members were confined to homes during the period of lockdown.
Older vs. newer Member States
As a first stab at looking at more disaggregated trends, we disaggregate the EU into older (EU14) and newer (EU13) Member States (Figure 2). Significant divergent trends are apparent. To keep the trends in context, we should bear in mind that the EU14 accounts for around four-fifths of total factor income in the EU, and the EU13 accounts for the remaining one-fifth. However, at the start of the period, half the agricultural labour force was in the EU13 countries, and the other half in the EU14 countries.
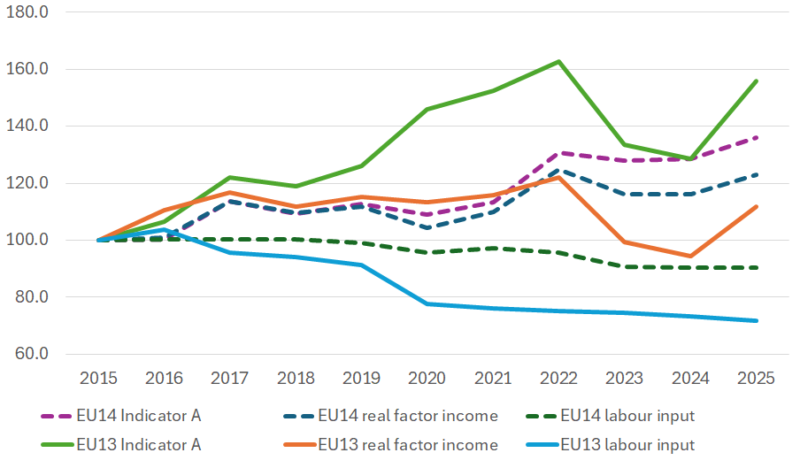
Sources: As for Figure 1. Dotted lines are the EU14 series, while solid lines represent the EU13 series.
Looking first at the Indicator A series, real factor income per AWU rose by 56% in the newer Member States but by only 36% in the older Member States over the whole period. The series has been much more volatile in the EU13. There was a sharp drop in real factor income per AWU after 2022 which was only partially recovered in 2025. This is due mainly to developments in real factor income, which in 2024 even dropped below the level in 2015. The positive development in Indicator A in the EU13 is also due to the greater reduction in labour input, where particularly the step change between 2019 and 2020 plays a role.
For the EU14 countries, real factor income increased up to 2022 after which it declined and had still not fully reached the 2022 level in 2025. However, the reduction in the total labour force which is visible after 2019 means that the 2025 value for Indicator A reached its highest level ever.
Country differences
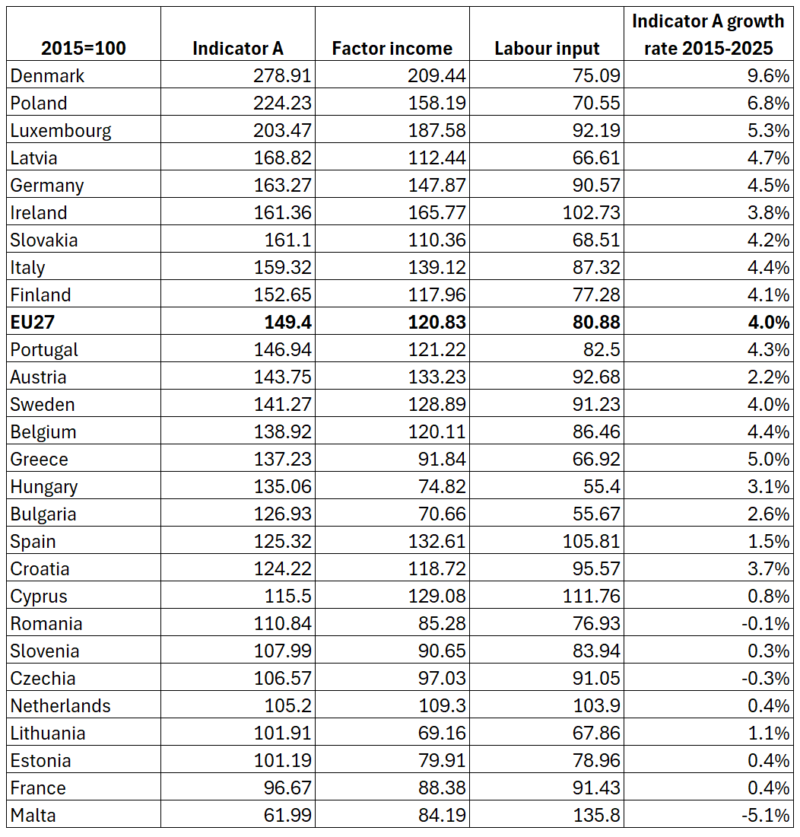
The EU average is a notional figure that cannot capture developments at the country level, which in turn will be influenced by the composition of agricultural output and the trends in factor income in different enterprises. Table 1 shows the trend in Indicator A by Member State, again broken down into its components.
Table 1 confirms that the EU27 increase in real factor income per AWU in agriculture of 49% between 2015 and 2025 was contributed in roughly equal parts by increases in real factor income and decrease in the labour force. However, Member States have experienced very different increases in real factor income per AWU. In Table 1, I have ranked countries by the increase between 2015 and 2025. Denmark stands out at the head of the table, with almost a tripling in the value of real income per AWU over the period, followed by Poland with almost a doubling. At the bottom of the table are Malta and France where, despite a fall in the number of AWUs, real income per AWU has fallen over this period.
There is always a danger in calculating trends in an agricultural variable from one single year to another. Given the volatility of agricultural incomes, either the start year or end year may be atypical and give a misleading impression of the trend rate of change. For example, Poland experienced an increase of 33% in real factor income in 2025, while Luxembourg experienced an increase of 35%, compared to the previous year 2024. Greece, on the other hand, had a 11% fall in its real factor income in 2025 compared to 2024 which pulls its ranking down. These unusual changes partly explain the positioning of these countries in the Indicator A column.
For this reason, I have also calculated the exponential growth rate for Indicator A (real factor income per AWU) in Table 1 which helps to smooth out these atypical years. While the ranking remains broadly the same, there are some changes for individual countries. Denmark and Poland remain at the top of the rankings, but at the bottom Czechia and Romania join Malta in experiencing a negative rate of growth in Indicator A, while France, Estonia and Netherlands show a positive but low growth rate over period.
Sources: As for Figure 1.
Based on the drivers of the change in real income per AWU, we can classify countries into four groups, as in Table 2.
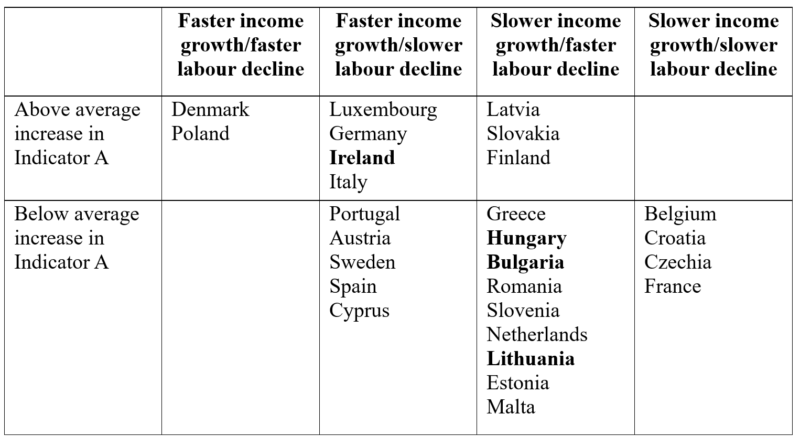
Source: Own calculations based on data in Table 1.
It is no surprise that the two countries at the top of ranking by the increase in Indicator A both experienced more rapid increases in real factor income and more rapid decreases in labour input. Three countries had overall a faster increase in Indicator A because of more rapid increase in real factor income, despite a slower rate of decline in labour input than the EU average. Ireland is bolded in this cell because it even experienced an increase in labour input. Finally, there are three countries in the top row with a faster increase in Indicator A despite a slower increase in real factor income, because of an above-average decline in the labour force.
Turning to the second row listing countries with a below-average increase in Indicator A, five countries are in this category despite a higher increase in real factor income because of a below-average decline in the labour force. While the latter characteristic may seem to be a desirable achievement, we should remember that structural change is at least as important a driver of rising agricultural income per AWU as increases in real factor income itself.
There are also a group of countries that fall into this category despite having a faster rate of decline in the labour force because of a very poor performance with respect to growth in real factor income. Hungary, Bulgaria and Lithuania are bolded in the table because their level of real factor income in 2025 was only between 70-75% of the 2015 level. Finally, there are four countries which experienced both a slower rate of increase in real factor income and a slower rate of decline in labour input. Czechia and France are bolded because, based on the year-on-year comparison used to construct this table, real factor income in 2025 was below its 2015 level (again, I caution that the classification in this table is based on simple year-to year comparisons which, as the French data illustrate, can be overly influenced by an atypical year).
The reasons for these very different evolutions in real factor income, labour input and Indicator A are clearly worthy of more detailed study. In this post, we simply underline that looking at average EU data alone can give a very misleading indication of trends in individual Member States.
Conclusions
We draw two conclusions from this examination of the economic accounts for agriculture data. First, real factor income per AWU in agriculture in 2025 continues its upward trend. After the volatility of recent years, the 2025 value is back on trend and reached a record level. The average 4% growth rate over the period in real terms is higher than the real growth of earnings in the nonfarm sector, and has contributed to closing further the farm-nonfarm income gap.
Second, we observe very considerable heterogeneity in the income growth experience across countries. Broadly, real agricultural incomes have grown more rapidly in the newer Member States than in the older Member States. This is due entirely to a more rapid decline in the agricultural labour force, as real factor income in the sector has grown more slowly than in the older Member States, especially due to the turbulence they have experienced in recent years.
This heterogeneity is even more marked at the individual country level. The difference in real income growth per AWU between Poland and other newer Member States is striking. What accounts for this? Similarly, there is a huge difference between the real income growth per AWU between Germany and France, for example. In both countries, agricultural labour input fell by almost the same amount over the period (a fall of 9%). But real factor income for the sector increased by 48% in Germany but fell by 12% in France (I caution again that these percentages are calculated on a year-to-year basis, but the general trend is clear).
Some of these differences can be accounted for by differences in agricultural specialisation and the composition of agricultural output. But my sense is that the differences more likely reflect causes more deeply-rooted in national structures and policies. There is a fascinating research agenda here to pursue.
This post was written by Alan Matthews.
Photo credit: One of Gerard Richter’s landscape paintings on display currently at the Fondation Louis Vuitton retrospective in Paris, own photo.

O artigo foi publicado originalmente em CAP Reform.