DG AGRI published its first status report on the implementation of country CAP Strategic Plans for the years 2023-2024 in June 2025. The report is based on the Annual Performance Reports that Member States must submit to the Commission by 15 February for the financial year ending the previous 15 October. Thus, this report draws on the Performance Reports submitted for the second year of the programming period ending October 2024. As area and animal-based payments paid in the financial year October 2023-October 2024 refer to claim year 2023, much of the data in practice refers to the first year of implementation of the new CAP.
This report appears to replace, at least for Pillar 1 payments, the very informative annual ‘Summary reports on the implementation of direct payments (except greening)’ in successive claim years published by DG AGRI for the previous CAP. These reports gave a detailed and granular account of the way in which individual member states implemented each of the individual direct payment instruments.
Most of this detailed information is lost in the new publication format. The Commission website offers a link to its Result Indicators Dashboard to explore the annual progress of CAP implementation. But these and other dashboards in the CAP 2023-2027 section of the Agri-food Data Portal (e.g. the Planned Outputs by Theme) now provide information only on the output and result indicators that are specified in the CAP Strategic Plan Regulation. While these are useful, they do not provide the granular information on the interventions that we had in the past.
It seems that these data are still being reported by Member States to DG AGRI because it makes reference to them in its 2023-2024 status report. For example, I might like to know the number of farms in each Member State that receive the redistributive payment CRISS, the area covered by these farms, and the average size of top up these farms receive. I can get the latter information from the Result Indicators Dashboard because it happens to be a specific Result Indicator R.6 ‘Percentage of additional direct payment per hectare for eligible farms below average physical farm size (compared to average payment per hectare)’ (for the curious, the EU average is 8% higher support per hectare). But I can no longer find the number of farms that benefit from this payment nor the area covered (the status report reports that about 44% of the total EU agricultural area benefits from redistributive income support so the information is reported). But there is no breakdown in the status report by Member State as these are not specific Result Indicators.
To give another example, I would like to know the proportion of farms in each Member State that benefit from eco-schemes (we have heard that the take-up in some Member States has been disappointing, and it would be useful to be able to check if this is the case and which are the Member States concerned) and the average size of payment. There is no specific Result Indicator for eco-schemes so the DG AGRI website gives no information specifically on the take-up of this measure. But the information is reported by Member States because DG AGRI presents a figure showing the share of agricultural area covered by eco-schemes in each country in its status report which I reproduce below.
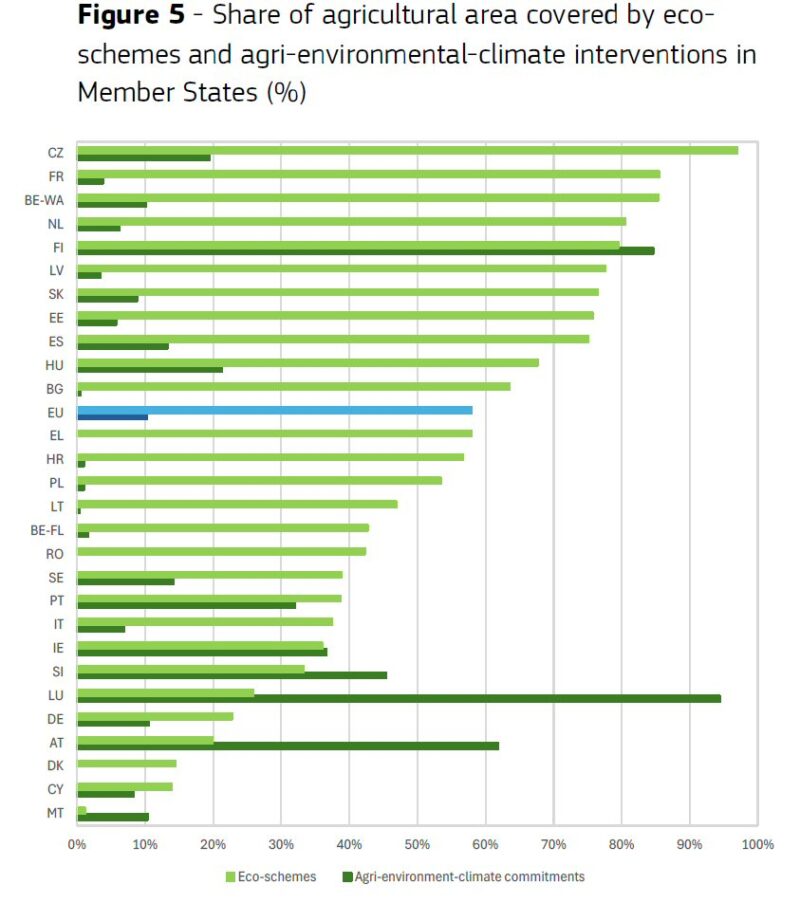
Source: European Commission DG AGRI, The 28 CAP Strategic Plans Underway: Summary of implementation in 2023-2024 – facts and figures, June 2025 update.
A difficulty I have with this figure is that it appears to include incorrect data. I take the example of Ireland, where the figure shows that around 36% of the agricultural area is covered by eco-schemes. But the Annual Review and Outlook 2024 published by the Irish Department for Agriculture, Food and the Marine states (p. 246) that “(In 2023) Ninety-seven percent of farmers that made a BISS application also applied to Eco-schemes”. While this proportion refers to the number of farmers and not the area covered, given that virtually all Irish farmers eligible for payments also received an eco-scheme payment the difference cannot be very great. Correcting for this would put Ireland at the top of the ranking with the Czechia rather than close to the bottom.
The point I am making is that, in moving from the previous CAP programming period to the current one, it seems that outside observers have lost access to a significant amount of information on the implementation of the CAP. Furthermore, it is not that DG AGRI does not have this information but rather that it does not make it available in an accessible format.
This not only makes it more difficult for outside observers to assess progress in the implementation of the CAP (as in my eco-scheme example). It also means that possibly incorrect information which is used by DG AGRI for evaluation (or for making national recommendations to Member States as envisaged for the next programming period) goes unreported.
I appreciate that, through the Agri-food Data Portal, DG AGRI is trying to make more data accessible to a wider public. But in the specific case of data to assess the implementation of the CAP, we seem to have take a major step backwards. Of course, if I have overlooked a source for this information I would be delighted to hear of it in the comments.
This post was written by Alan Matthews.

O artigo foi publicado originalmente em CAP Reform.