Agricultural structure data represent the crown jewels of agricultural policymaking. For researchers and policymakers alike, the Farm Structure Survey and Agricultural Census are a rich and detailed source for understanding how Europe’s farms operate and evolve. They provide indispensable insights into the dynamics of land use, labour, and production systems, informing strategies for food security, generational renewal, environmental stewardship, and rural development.
In this post, I look at how agricultural structure data are used to track changes in the structure of agricultural holdings over time. I focus in particular on the statistical coverage of the data, the population of holdings that are included. Choosing different cut-off points for the population of holdings represented by the data can give us very different pictures of the agricultural sector.
For example, in a statistical brief summarising the results of the 2020 Agricultural Census, Eurostat informs us that there were 9.1 million agricultural holdings in the EU, of which 2.9 million holdings (the equivalent of 31.8 %) were located in Romania. However, if we limit the population to those holdings that account for 99% of total agricultural output in the EU, the total number of holdings falls to 6.4 million, and Romania’s share falls to 15.5%. This tells a rather different story about the structure of agriculture. Which story we want to emphasise will depend on the standpoint of the narrator.
The Integrated Farm Statistics Regulation (EU) 2018/1091
Before continuing to explore the data, we first need to understand the data on structures that Member States are required to provide. For the decade of the 2020s starting with the Agricultural Census 2020, the relevant Regulation is the Integrated Farm Statistics Regulation (EU) 2018/1091. This Regulation replaced the Farm Structure Surveys Regulation (EC) No 1166/2008 which governed the collection of data from 2010 until 2016.
Legal thresholds. The coverage of holdings is specified slightly different in the two Regulations. For the 2008 Regulation, the coverage was defined as follows:
1. (a) agricultural holdings where the agricultural area utilised for farming is one hectare or more;
(b) agricultural holdings where the agricultural area utilised for farming is less than one hectare, if those holdings produce a certain proportion for sale or if their production unit exceeds certain physical thresholds.
2. However, Member States which use a survey threshold above one hectare shall fix this threshold at a level that excludes only the smallest agricultural holdings which together contribute 2 % or less to the total utilised agricultural area excluding common land and 2 % or less to the total number of farm livestock units.
3. In any case, all agricultural holdings reaching one of the physical thresholds specified in Annex II shall be covered.
In the 2018 Regulation, the required coverage is set out in Article 3 as follows. The basic obligation is that the data shall cover 98% of the total UAA (excluding kitchen gardens) and 98% of the livestock units of each Member State (Art. 3(1)).
In order to meet those requirements, Member States shall provide data that meet at least one of the physical thresholds listed in Annex II with regard to the size of agricultural land or the number of livestock units (Art. 3(2)).
By way of exception, where this frame represents more than 98% of the national agricultural production, measured by the Standard Output, Member States may establish higher physical or corresponding economic thresholds to reduce the frame, as long as the 98% coverage of the total UAA (excluding kitchen gardens) and 98% of the livestock units of the Member States is reached (Art. 3(3)).
Where the frame specified under Art. 3(2) does not represent 98% of the UAA and 98% of the livestock units, Member States must extend the frame by establishing lower thresholds than those listed in Annex 2, or by establishing additional thresholds, or both (Art. 3(4)). However, because the holdings below the physical thresholds are so small and to keep costs manageable, Member States are permitted to use a sample data collection every ten years to estimate their structure and impact on production.
The physical thresholds set in both Regulations were unchanged. All holdings meeting any of the following physical thresholds set out in Annex II of the 2018 Regulation must be included:
- 5 ha of UAA
- 1 ha of permanent outdoor crops
- 0.5 ha of vegetables, melons, strawberries (outdoors), tobacco, hops, or cotton
- 0.1 ha of crops under glass (e.g., vegetables, flowers)
- 10 bovine animals
- 50 pigs
- 20 sheep or goats
- 1,000 poultry
The two Regulations thus set out coverage thresholds (Member States must ensure that the survey covers at least 98% of total UAA and LSU) and physical thresholds (e.g. 5 ha UAA, 10 cattle, etc.). These thresholds define the minimum coverage required for EU-wide comparability. The main difference between the 2008 and 2018 Regulations concerning coverage was the additional requirement in the 2008 Regulation that all holdings with more than one hectare of agricultural area should be included, in addition to all holdings exceeding the physical thresholds. However, this was not a mandatory requirement because, as set out in the legislation, countries could set higher thresholds if they still met the minimum coverage requirements.
Operational thresholds. Eurostat publishes the thresholds used by Member States in each reference year for the survey (operational or applied thresholds). In 2020, for example, although the intention to include all holdings with more than 1 ha is no longer included in the legislation, the data show that many Member States used a lower threshold than the legal physical threshold of 5 ha for utilised agricultural area (for example, Austria used 3 ha, Poland used 1 ha, while Greece used 0.1 ha).
Figure 1 shows the coverage choices made by Member States for the 2020 Agricultural Census. Only Sweden and Germany (as well as Norway outside the EU) opted for higher thresholds than the legal thresholds (and these for physical thresholds other than the UAA threshold of 5 ha). However, many Member States needed to lower the legal thresholds for area in order to capture the fundamental requirement to cover at least 98% of agricultural land and 98% of livestock units.
Core and module data. The variables to be collected are allocated to different collection groups (core data and modules) that vary in frequency and representatives, or both. The core structural data are collected for all holdings that exceed one of the physical thresholds (taking account of where exemptions have been given to Member States) and in 2020 (a Census year) also for holdings included in the frame extension (where the latter can be collected by sampling). Module data (for which specific topics are defined, such as the ‘labour force and other gainful activities’ module, the ‘rural development’ module, or the ‘irrigation module) need only be collected for holdings that exceed the physical thresholds. While most countries that used a frame extension also collected the module data for these smaller holdings in 2020, some of these countries did not (ES, LT, SI), as permitted by the legislation (see the Eurostat metadata for further discussion). Thus, comparisons between countries need to be made with caution.
Care must also be taken in making comparisons across countries over time. In the tables below, data are presented for the reference years 2010, 2013, 2016, and 2020 (2023 data have been validated and published for some but not all Member States so are not included in this post). The most likely reason for discontinuities is where a country has changed its survey thresholds during this period, but also changes in the definition of an agricultural holding or changes in the way data are collected can influence the trends.
EU-wide comparisons
To illustrate the significance of these statistical thresholds, we first present the available data for the EU as a whole for four variables: utilised agricultural area in thousand hectares, standard output in million euro, agricultural work units, and the number of holdings (Table 1). The table distinguishes between those holdings that meet the operational thresholds used by each Member State (‘above threshold’) and those holdings enumerated although they fall below the operational thresholds (‘below threshold’). These holdings are not part of the core survey population but are included in the decadal Agricultural Census. These data are often compiled or estimated using administrative data or extrapolation.
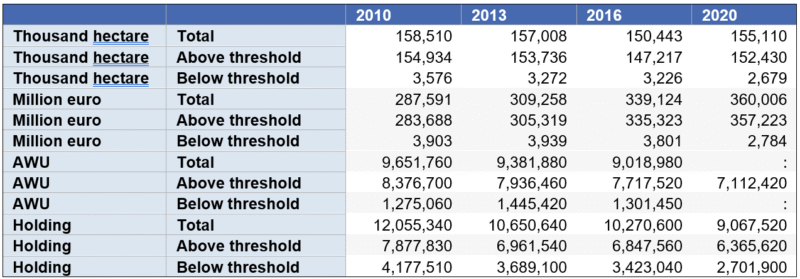
Source: Eurostat, Farm indicators by legal status of the holding, utilised agricultural area, type and economic size of the farm and NUTS 2 region [ef_m_farmleg].
We focus first on the agricultural area. Recall that a requirement under the legislation is that the operational thresholds used should ensure coverage of at least 98% of the agricultural area (excluding kitchen gardens). This is the case in all reference years. When we examine the standard output, the coverage rate is even higher at 99% in all reference years.
Examining the trend in Agricultural Work Units (AWU) for the available years, we see that the core data capture a steady 86% of the total AWUs. What is interesting is that the decline in this total is due entirely to a fall in the number of AWUs captured in the core data, while the number below the threshold has been approximately stable.
Of particular note are the data on the number of agricultural holdings. Here, on average, the core data cover only 67% of the enumerated holdings. But these holdings account for 98% of the total agricultural area and 99% of the total standard output. We can learn more about the ‘below threshold’ holdings by comparing the number of holdings with the agricultural area they manage. In each reference year, we can see that the average size of these holdings is less than 1 ha. They are no doubt an important source of food security for these families, but whether we should consider these holdings as part of the ‘agricultural sector’ is open for discussion.
The relative importance of these ‘below threshold’ holdings is not uniform across Member States (Figure 2). In fact, in around half of the Member States, all or nearly all holdings are enumerated as part of the core data. What brings down the EU average are particularly the high shares of non-core holdings in Bulgaria, Latvia and especially Romania (given its high share of total EU holdings overall).
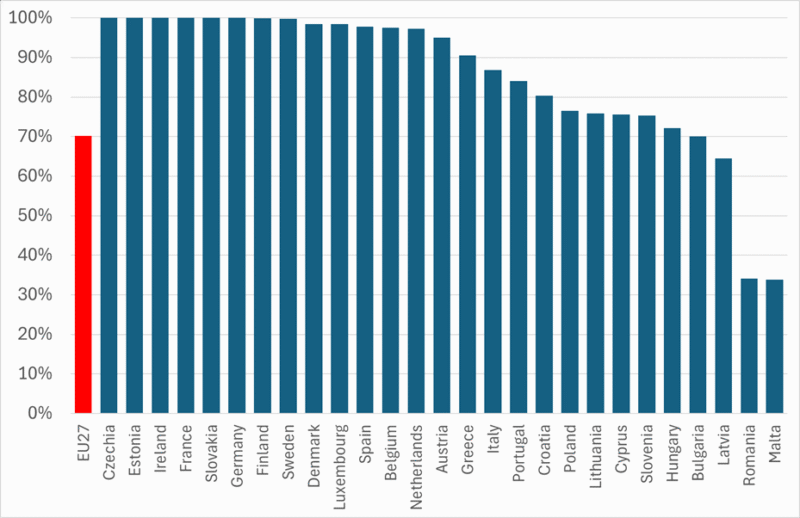
Source: Eurostat, Farm indicators by legal status of the holding, utilised agricultural area, type and economic size of the farm and NUTS 2 region [ef_m_farmleg].
Conclusions
The agricultural structure statistics play a crucial role in debates around the Common Agricultural Policy. There is huge political interest in variables such as the number of holdings over time, the trend in the numbers engaged in farming, and the age structure of farmers. The purpose of this post is to alert users of these statistics to the importance of being clear on the coverage of the statistical population for which these variables are measured.
The coverage of structural data is intended to ensure that the holdings included must cover at least 98% of the total UAA (excluding kitchen gardens) and at least 98% of the livestock units of each Member State. The legislation defines a set of physical thresholds and any holding that exceeds one or more of these thresholds must be enumerated. For many Member States, including only those holdings that meet the physical thresholds is not sufficient to reach the overall coverage required. These Member States must then extend the frame for coverage either by lowering the physical thresholds or adding new thresholds. The holdings enumerated in this way form the basis for the collection of the core structural data.
However, in many Member States administrative and other records can reveal a further set of holdings that are even smaller than these operational thresholds, on average, smaller than 1 ha in size. These holdings are counted when undertaking an agricultural census, and Eurostat records them separately as holdings ‘below threshold’. This distinction is available for the reference years 2010 onwards but not earlier. By construction, these holdings cannot account for more than 2% of agricultural land, and in practice account for only 1% of EU standard output.
I would argue that political debate should focus on trends in those holdings covered by the core structural data. To illustrate why this is important, the total number of holdings declined by 25% in the ten years 2010 to 2020. But the number of holdings in the core structural statistics declined by just 19% during this period, as the number of ‘below threshold’ holdings declined much faster by 35%. Those who focus on the total numbers will observe a fall in the number of holdings from 12.1 million in 2010 to 9.1 million in 2020. The fall in the number of holdings that contribute to the agricultural sector, however, was from 7.9 million to 6.4 million. This fall is still significant, but it is less that what the headline figures suggest.
This post was written by Alan Matthews.
Photo credit: Field of poppies near Værløse, private photo.

O artigo foi publicado originalmente em CAP Reform.